Dynamo MC™ offers a variety of customization options. To find these options within the program, click “Options” under the “Tools” menu.
Please be aware that you must click “Save & Exit” when leaving the options for your options to be saved. If you have made changes, Dynamo MC will remind you that leaving this screen will cause your changes to be lost.
Options – General
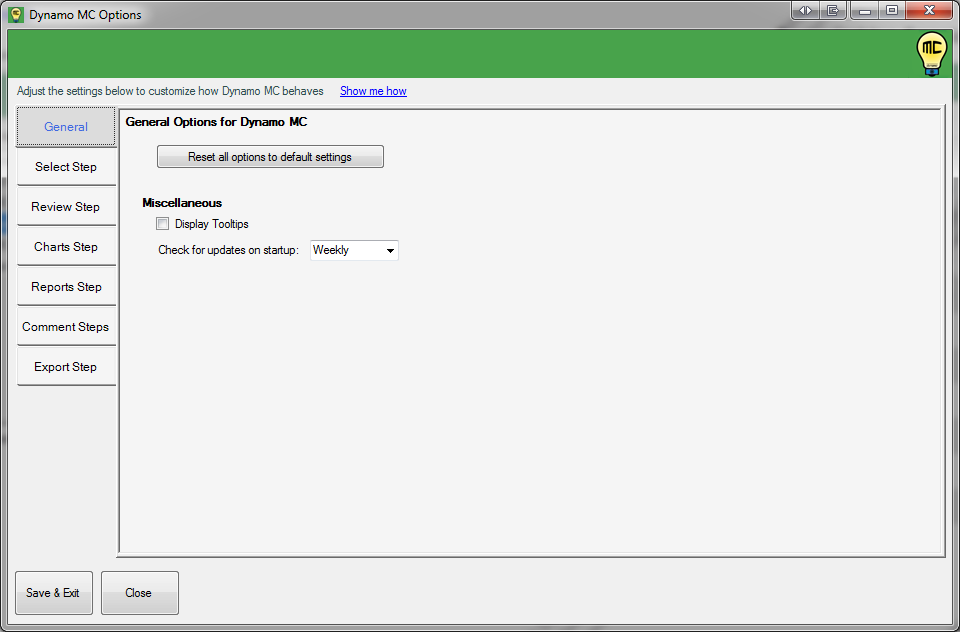
General options
Reset all options to default settings:
This button will reset all options to their default values. This applies to all tabs in the options screen.
Display Tooltips:
This checkbox will enable/disable tooltips in Dynamo MC. This applies to all screens in the application.
Check for updates on startup:
This select box specifies how often Dynamo MC should check to see if an update is available. If enabled, this check will be performed on startup. Please consider leaving the update check enabled, as this will let you know when a new version is available. You will have to check for updates manually if you choose to set this to “never”.
Options – Select
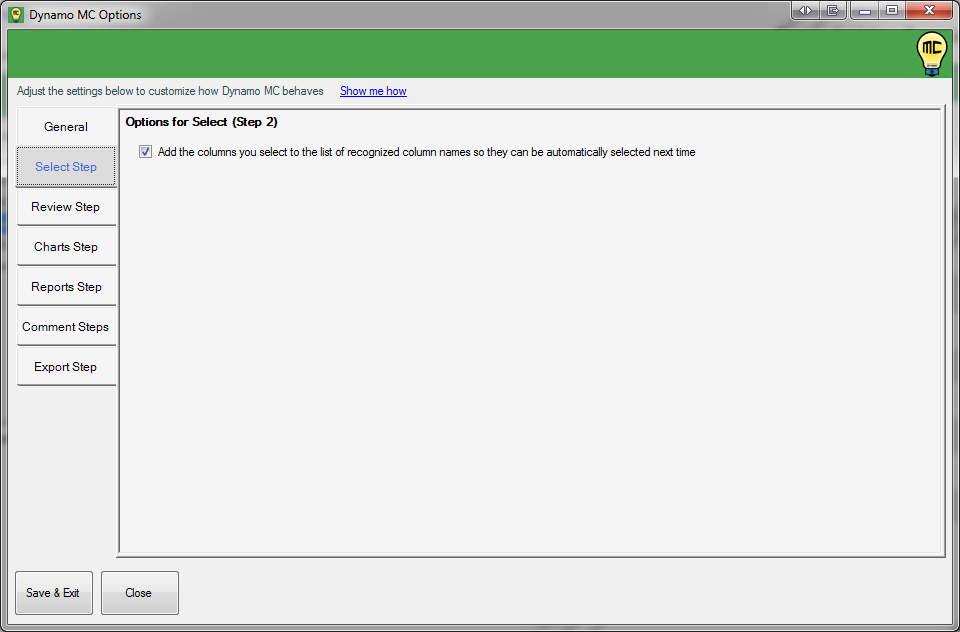
Select Options
Add the columns you select to the list of recognized column names so they can be automatically selected next time:
This checkbox allows Dynamo MC to to automatically add new columns you select to its list of recognized column names. This allows Dynamo MC to automatically select these columns the next time it encounters them. This is very useful when Dynamo MC is learning the data files you are using, but it could also learn your mistakes if you accidentally selected a column. You may wish to disable this if you are loading some files that are incompatible with the files from your normal workflow. Most of the time, keeping this checked will make using the program easier.
Options – Review
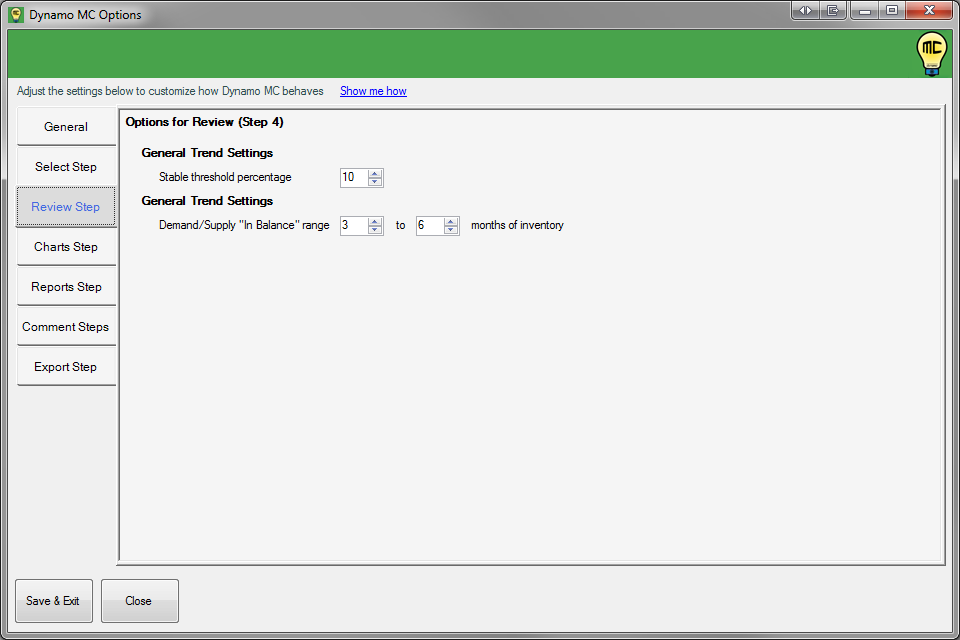
Review Options
General Trend Settings – Stable threshold percentage:
This input allows you to tell Dynamo MC how much a trend can change and still be considered stable. Obviously, values are very infrequently going to be the exact same over the course of a year, so this allows you to provide your own threshold. This defaults to 10%. In this case, a value that has increased by 11% (111% of the original value) will be considered to be “increasing”, and a value that has decreased by 11% (89% of the original value) will be considered to be “decreasing”.
General Trend Settings – Demand/Supply “In Balance” range:
This input allows you to tell Dynamo MC how many months of inventory is considered to be “in balance” in your market. This range is used to calculate the “Demand/Supply” trend in the One-Unit Housing Trends section. In most markets, a supply of 3 to 6 months is considered to be normal, but you can change this to any amount that you consider to be appropriate for your market.
Options – Charts
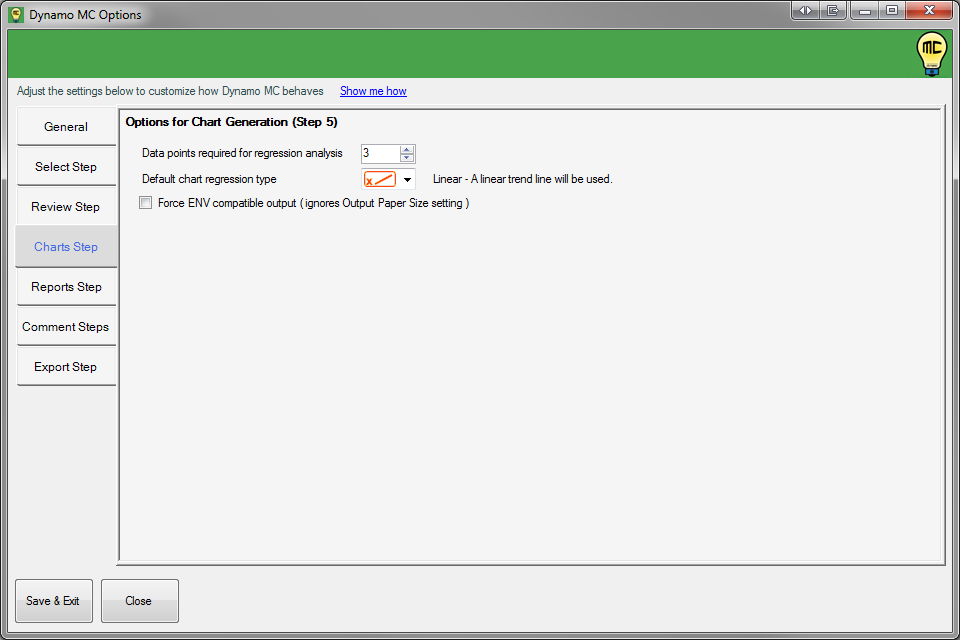
Charts Options
Data points required for regression analysis:
This input allows you to tell Dynamo MC how many data points must be present before regression analysis can be performed. This defaults to 3 data points, but you may wish to increase this if you feel that does not offer a sufficient sample size.
Whenever the number of data points falls below this number, the charts and reports utilizing regression analysis will clearly read “Regression Analysis Unavailable”, and no trend line or linear regression calculations will be displayed.
Default chart regression type:
This input allows you to tell Dynamo MC which regression type should be used as a default when a new chart is added to the selected charts list. This also applies to the regression type to use on any chart that is added to the TOTAL workfile (when it does not exist in the selected charts list).
Force ENV compatible output (ignores Output Paper Size setting):
This input allows you to force Dynamo MC to use a from for all charts that will be compatible with ENV deliveries within TOTAL. Without this checked, the forms that are currently used will not work properly, due to a compatibility problem that currently exists within TOTAL. Checking this box will allow you to deliver your charts in the ENV, but you will no longer be able to choose between legal and letter sized paper output when using this.
Options – Reports
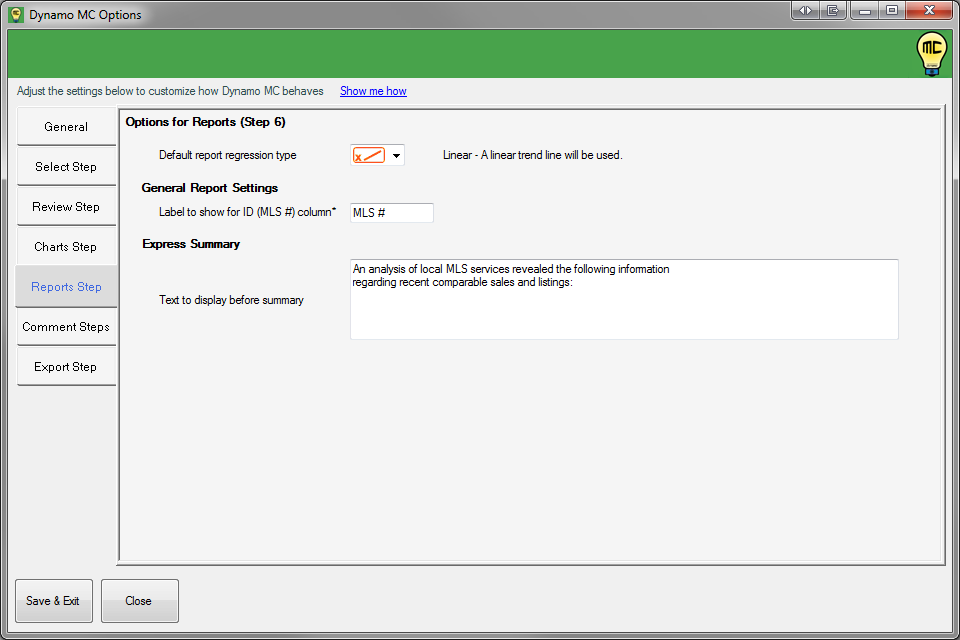
Reports Options
General Report Settings – Label to show for ID (MLS #) column:
This allows you to have Dynamo MC substitute a custom label for the MLS column in any reports that Dynamo MC creates. This may be useful if you would like to substitute the name of your local MLS, as some AMCs are now requiring.
This option applies to multiple reports.
Note: When no identifying columns (MLS # or Address) have been provided in the data, the row number will always be shown in reports. In this case, this field will not be used, as the MLS number will not be able to be displayed. This will only happen if you do not provide sufficient optional columns in order to adequately identify a property.
Express Summary – Text to display before summary:
This input allows you to specify the text that Dynamo MC displays before the calculations on the Express Summary report. Please be aware that if you enter too much text, it may be possible for the calculations to extend onto a second page.
Default chart regression type:
This input allows you to tell Dynamo MC which regression type should be used as a default when a new report is added to the selected charts list. This also applies to the regression type to use on any report that is added to the TOTAL workfile (when it does not exist in the selected reports list).
Options – Comments
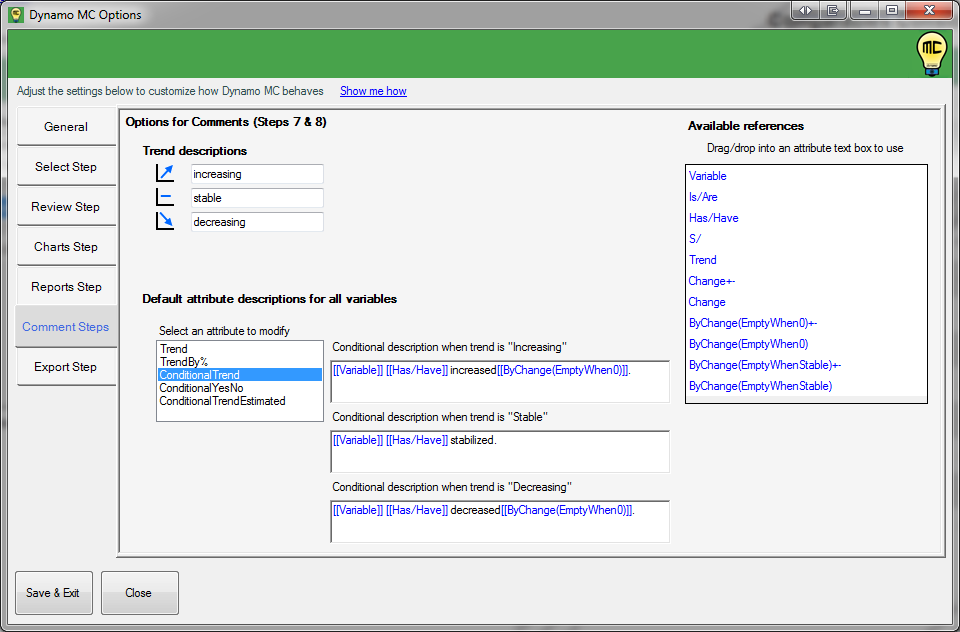
Comment Options
Trend Descriptions:
This allows you to specify the descriptions for trends that Dynamo MC will use as it generates comments. This value will be used by the “Trend” reference that is available on this screen, and also on the variable editor. It is recommended to provide values that match one another, as the data will decide when each is used as trends change with the data.
Default attribute descriptions for all variables:
This section works in concert with the variable editor, and provides the default values that are used when the “use default values” checkbox is checked.
This sections provides you with a way to change the default values used across all variables in the comments sections by editing the attributes that these variables contain. To change these, first select an attribute from the “select an attribute to modify” list.
Depending on the attribute that was selected, between 1 to 3 input boxes will be shown. You may edit these by typing into them directly, or by dragging in a reference from the “Available references” list.
Unlike on the variable editor, you cannot see a “preview” output of these values. This is because these attributes are used by multiple variables.
Please be aware that changing these settings may change how multiple variables are generated, so please be sure to test the results within the variable editor and comments steps prior to using them in an appraisal. Always pay close attention to your output after you have made changes here.
References?
A reference helps Dynamo MC to say useful things about our data.
References are the most basic bits statistics that Dynamo MC collects from our data. This may be the direction of change, the amount of change, or the correct name to use for a label. References are used to build attributes.
Attributes?
An attribute is basically a plain english statement about the data that can still change as the underlying data changes.
If you’ve seen the comments steps, you’ve already seen them in the variable text. When we paste in [[MediaSalePrice.Trend]], “MedianSalePrice” is actually the variable that we are reporting about, and “Trend” is the attribute that belongs to it. So even though these are shown on the comments page as [[Variable.Attribute]], we still refer to them as “Variables” on the comment sections to keep it simple.
Select an attribute. When one input box is shown, an attribute is non-conditional. It will always be displayed using the text and references that it is composed of. The following attributes are always non-conditional:
- Trend – By default, simply states the name of a variable, and gives its general overall trend.
- TrendBy% – By default, states the name of a variable, gives its overall trend, and specifies by how much it has changed when the trend is not stable.
These attributes are conditional, and when they are selected, multiple inputs will be shown.
- ConditionalTrend – This will specify three distinct inputs: Increasing, Stable, and Decreasing. The input that corresponds with the trend detected in the data will be the input that is used.
- ConditionalYesNo – This will specify two distinct inputs: Yes and No. This is used with “Yes/No” questions that are answered on the 1004MC form, and the input that corresponds with the answer will be the input that is used.
- ConditionalTrendEstimated – This will specify three distinct inputs: Increasing, Stable, and Decreasing. This is different that “ConditionalTrend” because it only applies to the trend questions that are answered on the 1004MC form. The data does not specify which trend is used, so its default wording is slightly different to make it clear that this is based on an estimation by the appraiser. The input that corresponds with the answer will be the input that is used.
Attributes may contain static text and references.
Different variables contain different attributes, so please check on the comments pages or in the variable editor to see what is available.
Available References:
This is a list of the references that can be used in the attributes. Different references will be available depending on the attribute you have selected. Available references are always shown in blue, whereas unavailable references are shown in grey.
Selecting a reference causes the “Reference explanation” box to appear.
Reference Explanation:
This shows a brief explanation of the selected reference, as well as an example of some possible values that can occur when using it.
Options – Export
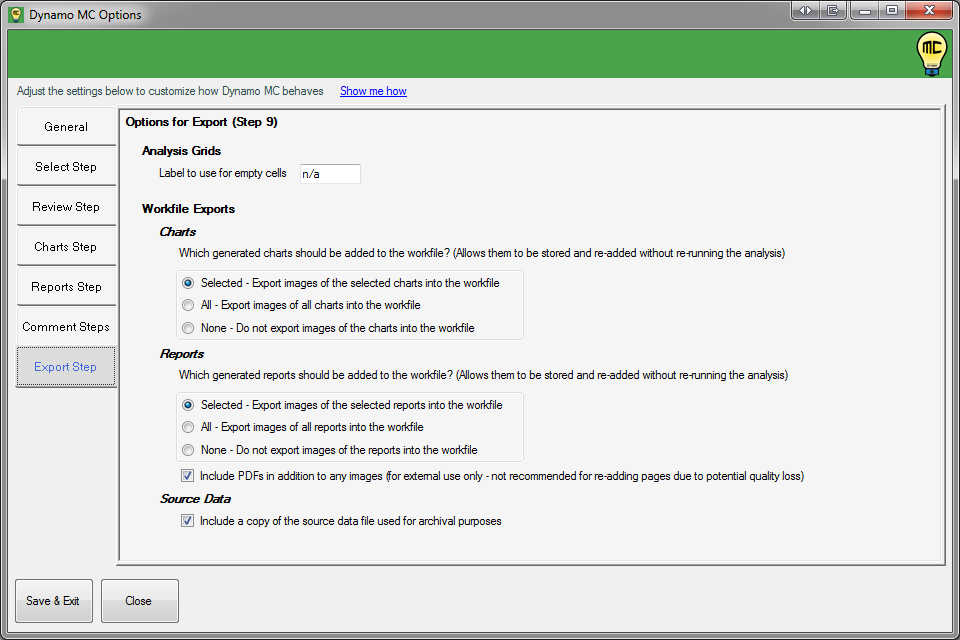
Export Options
Analysis Grids – Label to use for empty cells:
This tells Dynamo MC to substitute custom text into a 1004MC analysis cell whenever the result is a null, or empty value. Using a value here may prevent AMCs from flagging your 1004MC for missing values. If you leave this box blank, Dynamo MC will simply leave your analysis values blank. Whether you use it or not is up to you as an appraiser.
Workfile Exports:
Charts:
Dynamo MC can be configured to automatically store generated charts into the TOTAL workfile when data is exported. This can be very useful, especially if you want to retain these charts for your own use, but not necessarily share them with your clients (unless asked to do so at a later time). The following options are given:
- Selected – This will add only the charts that you selected for export to your appraisal’s report workfile. You will see the same charts in the appraisal report’s form data and in your workfile.
- All – This will export all available charts to your appraisal’s workfile, regardless of whether you selected them for export.
- None – This will prevent any charts from being added to your appraisal’s workfile.
Reports:
Dynamo MC can be configured to automatically store generated reports into the TOTAL workfile when data is exported. This can be very useful, especially if you want to retain these reports for your own use, but not necessarily share them with your clients (unless asked to do so at a later time). The following options are given:
- Selected – This will add only the reports that you selected for export to your appraisal’s report workfile. You will see the same reports in the appraisal report’s form data and in your workfile.
- All – This will export all available reports to your appraisal’s workfile, regardless of whether you selected them for export.
- None – This will prevent any reports from being added to your appraisal’s workfile.
Workfile Exports – Include PDFs in addition to any images:
This tells Dynamo MC to create PDF documents for each report that it exports to your appraisal report’s workfile.
Source Data:
Include a copy of the source data file used for archival purposes:
This tells Dynamo MC to copy the data file you loaded into Dynamo MC to your appraisal report’s workfile. If you pasted your data in as text, you will find a .TXT file that contains your data. This can be very helpful if you ever make a mistake or need to find the data you used in an appraisal – especially if it happens years later!

